Ed. 068 · Pre-market intelligenceFri · 19 Jun 2026 · 08:30 IST
Gift Nifty slides as crude steadies, IT bleeds.
By Tradl AI12-min read · 4:16 audioBias Cautious–Neutral
▾ Today's CallGap-down · OI wall overhead
↓Gift Nifty gap-down ~170 pts. Open beneath 24068 — the Pivot S1 — shifts intraday sentiment from consolidation to distribution territory.
●OI wall band 24050–24300. PCR at 1.11 signals put writers still dominant, but a sustained print below 24050 empties that cushion.
↓IT sector lagging by -1.19%. ASML-China chip-tool concern sharpens sentiment against export-tech names; the sector's drag widened even as the broader tape was positive.
↑RBI Policy Minutes at 17:00 IST. Tone on liquidity and the rate path will reprice financials into the close — Bank Nifty pivot support sits at 57856.
Support floor
24,050
Yesterday close
24,168
Resistance ceiling
24,250
Gift Nifty -0.7%VIX 12.67 calmIT -1.19% lagsBrent +1.5% $79.39RBI Minutes 17:00DII net buyer +1561 Cr
01
Today's Trade Setups
prediction game · 23 Jun expiry★ Smart Chains · Beta
PREDICT · 2 sessions left
Where does NIFTY close on 23 Jun expiry?
community pot
—
predictions cast
★ Smart Chains · unlock the matching trade
3 risk-defined option chains for your prediction — Defensive / Balanced / Aggressive. Coming soon on Tradl AI.
Defensive
When the band is wide and event risk is near, a defensive stance favours patience over exposure.
Max profit
₹—
Max loss
₹—
R:R · —Lots · 1
Balanced
A balanced read leans on the midpoint holding while the yield overhang stays unresolved.
Max profit
₹—
Max loss
₹—
R:R · —Lots · 1
Aggressive
An aggressive read positions for the band break that the overnight minutes could trigger.
Max profit
₹—
Max loss
₹—
R:R · —Lots · 1
Educational only · not advice. Smart Chains is an upcoming Tradl AI feature: cast a directional view, get the matching option chain with max profit / max loss / breakevens / R:R.
02
Previous Session
Indian indices · prior session
NIFTY 50
24,168▲ 82.3 · +0.34%
Tap to expand · key levels inside
Last 7 sessions−0.12%−0.23%+1.99%+0.98%+0.57%+0.40%+0.34%Charts powered by TradingView
levels
Sensex
77,409.98
▲ 254.36 · +0.33%
Mirroring Nifty, upper-end close
levels
Bank Nifty
57,963.8
▲ 378.75 · +0.66%
Sector leader, six-up streak
levels
Gift Nifty
23,998
▼ 170 · −0.70%
Overnight gap pulls below spot
03
Sector Lens
17 sectors · 1-day
Tap a tile for deep-dive
▲ Leaders leading · improving
SectorRSMomDays1D
Media102.3101.09+0.55%
PSU Bank102.2102.07+0.66%
Private Bank102.0101.216+0.49%
Financial Services100.8101.04+0.67%
Realty100.7100.91+0.69%
Consumer Durables100.7101.31—
FMCG99.0100.31+0.20%
▼ Laggards lagging · weakening
SectorRSMomDays1D
PSE98.299.215+0.68%
Metal98.797.12-0.01%
Oil & Gas99.099.4120.00%
IT99.097.51-1.19%
Energy99.398.32+0.54%
Pharma99.698.40+0.56%
Healthcare99.798.90+0.98%
Infra99.899.65+0.31%
Auto100.499.70+0.08%
India Defence100.499.625+0.38%
live
Where money is rotating. Every NSE sector vs Nifty — leading, lagging or turning — with a 250-session replay and a sector→stock drill-down.
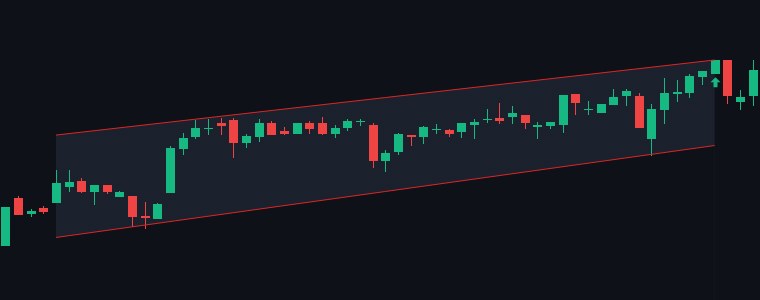
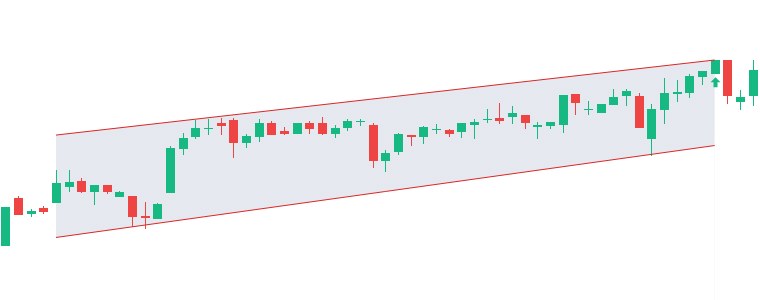
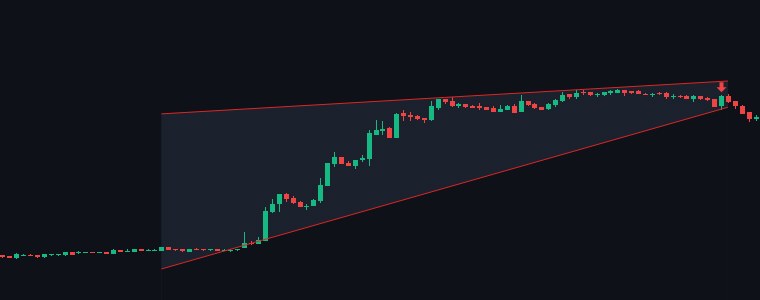
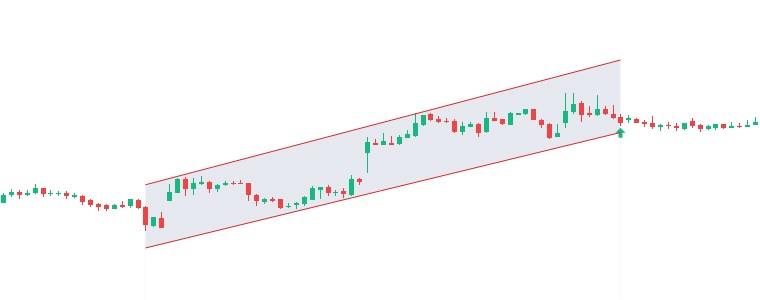
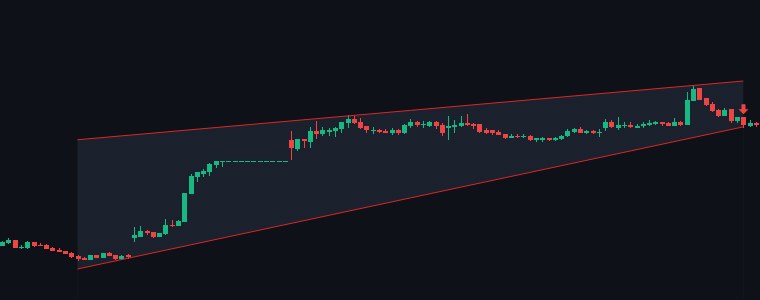
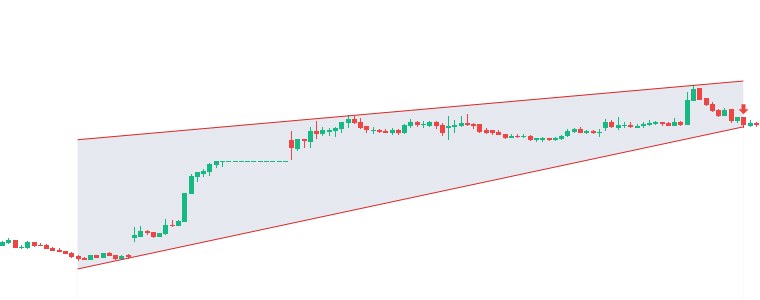
The ascending channel shows multiple clean, verified pivots on both upper and lower rails with consistent parallelism and well-contained price action.
81%
Start 17 JunDetected 17 Jun 15:10
NIACL5m
Bull Flag ▲ BULL
AI 85%
The pattern features a sharp, distinct flagpole followed by a tightly defined, parallel consolidation flag that adheres strictly to price highs and lows.
82%
Start 12 JunDetected 16 Jun 14:10
IDBI5m
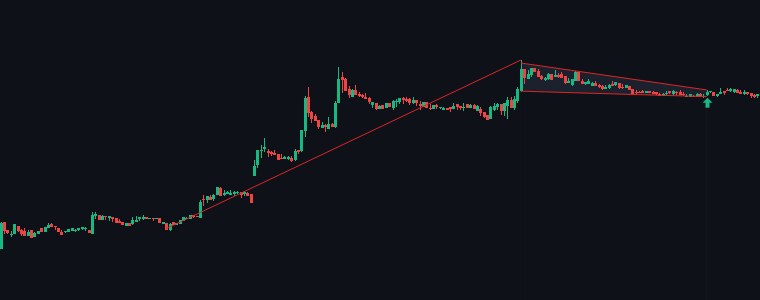
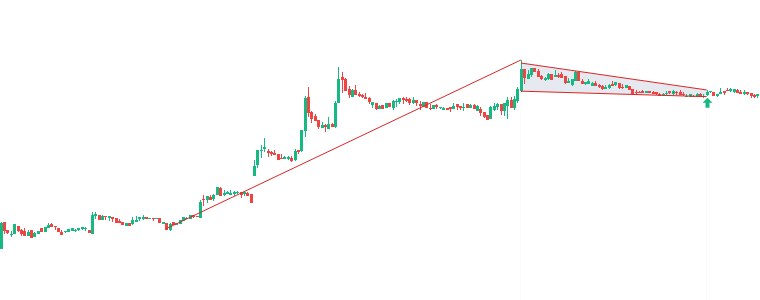
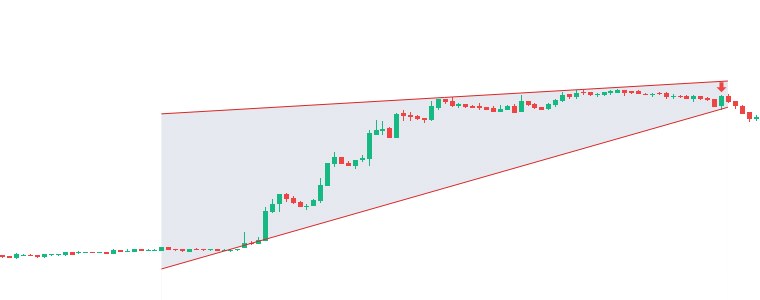
Rising Wedge ▼ BEAR
AI 90%
The Rising Wedge shows clear convergence with well-aligned pivots on both trendlines and is currently breaking through support with bearish intent.
90%
Start 16 JunDetected 17 Jun 15:00
REDINGTON15m
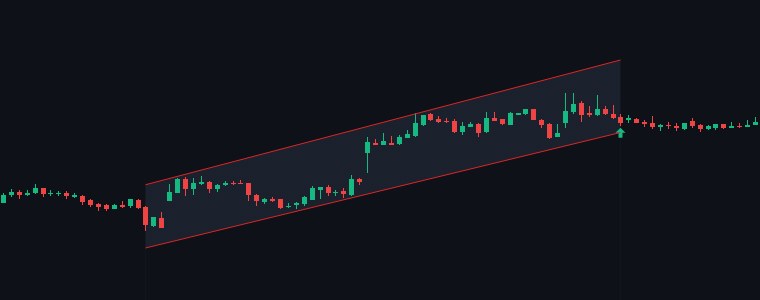
Ascending Channel ▲ BULL
AI 90%
The ascending channel shows multiple clean touches on both parallel rails, effectively containing price within a steady, well-defined bullish trend.
85%
Start 11 JunDetected 16 Jun 11:00
IFCI15m
Rising Wedge ▼ BEAR
AI 90%
The pattern shows clean converging trendlines with multiple touches, and the subsequent breakdown through the lower boundary confirms the bearish wedge…
85%
Start 11 JunDetected 17 Jun 14:45
AEGISVOPAK5m
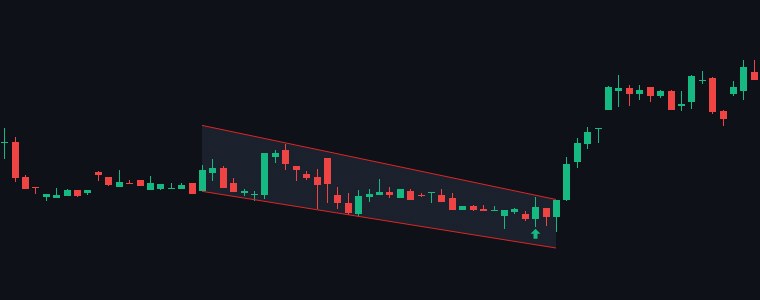
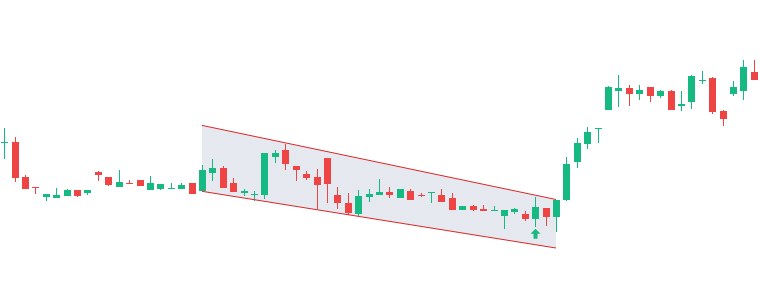
Falling Wedge ▲ BULL
AI 95%
The pattern shows clean convergence with multiple touch points on both rails, followed by a strong breakout that successfully reached and exceeded the target…
87%
Start 17 JunDetected 18 Jun 10:55
Pattern Detection Engine
6 patterns caught last session.
AI-verified chart formations across NSE-500 · timeframes 5m → 1h · match score > 80%.
— of 500 beta seats taken
06
Overnight Wire
global close
Global Equities
S&P
S&P 5007,501
▲ 1.1%Tech-led broad advance
DOW
Dow Jones51,565
▲ 0.1%Blue-chips lag tech
NDQ
Nasdaq26,518
▲ 1.9%Growth names outperform
NKY
Nikkei 22571,534
▲ 0.6%Asia ex-China follows Wall St
KSP
KOSPI9,382
▲ 3.3%Sharp catch-up rally
HSI
Hang Seng23,925
▼ 1.6%China diverges lower
Commodities
OIL
Brent Crude$79.39
▲ 1.5%Supply risk bid returns
WTI
WTI Crude$75.52
▲ 1.31%Crude reclaims $75 handle
AU
Comex Gold$4,206.20
▼ 3.1%Safe-haven demand unwinds
Rates · FX · Vol
DXY
Dollar Index100.8
▲ 0.57%Dollar steadies above 100
INR
USD/INR94.86
▲ 0.36%Rupee slips on dollar bid
30Y
US 30Y4.90%
▼ 2 bpsLong end eases marginally
10Y
US 10Y4.45%
▼ 1 bpsFront end anchored lower
GSC
India 10Y6.84%
▼ 2 bpsDomestic yields softening
VIX
India VIX12.67
▼ 3.90%Calm deepens further
Crypto· as of 07:30 IST
BTC
Bitcoin$62,926
▼ 2.53%Risk-off crypto selloff
ETH
Ethereum$1,710.36
▼ 2.54%Crypto correlation drag
07
Key Developments
post-close → pre-open
AlertCautionPositive for IndiaNeutral
GEOGeo
GEO07:13 IST
US Tells ASML It's Concerned China May Have Top Chip Tool
Don't miss a catalyst. Downloads a standard .ics file — import once into Google Calendar, Apple Calendar, or Outlook.
09
F&O Pulse
23 Jun expiry · 2 sessions
Nifty PCRbullish
1.11
PCR 1.11 · above 1.0 — bullish bias.
1.11
Max Pain23 Jun
24,100
Sits within range. 68 pts below close — magnet pull on quiet sessions.
F&O Heatlong/short OI
YESBANK · IDEA
Long: YESBANK, IDEA. Short: TMPV, ADANIPOWER.
Smart $ flowFII F&O
+890 Cr
FII building index-futures longs — risk-on positioning.
⊕ hover for FII option positioning
FII index-option positioning · net OI (contracts)
Index Calls
−2,63,051net
Long5.38L
Short8.01L
Δ day−31,029
Index Puts
+5,47,474net
Long10.19L
Short4.71L
Δ day−3,814
Options Battlefield· Nifty 23 Jun
Put writers (support) Call writers (resistance) Max Pain
24,050
0.50 Cr
24,100
Support
24,150
0.34 Cr
24,200
Resistance
0.70 Cr
24,250
0.29 Cr
24,300
0.60 Cr
MAX PAIN24,100 · 0.79 Cr
24,05024,10024,150 ●24,20024,25024,300
Put writers stacked at 24,100 PE (0.79 Cr OI) — that's the floor. Call writers stacked at 24,200 CE (0.70 Cr) and 24,300 CE (0.60 Cr) — ceiling. The 24,100 max-pain magnet sits 68 pts below close: in a quiet session, that's where the market wants to gravitate. Decisive close outside 24,050–24,300 forces writer unwinding — a directional move follows.
10
Flows & VIX
liquidity · 18 Jun
Net cushion · DII carry weight at ₹1,561 Cr; FII contribution a thin ₹102 Cr.
All figures · Cr · 18 Jun (T-1) provisional
FII CashT-1
+102
1st straight buying session.
1-day streak · +102 Cr cumulative
⊕ hover for FII F&O positioning
Index Futures+890 Cr
Index Calls−2,63,051 net
Index Puts+5,47,474 net
FII building index-futures longs — risk-on positioning.
NET
+1,663
DII pulling · floor holds
DII CashT-1
+1,561
Net cushion +1,663 Cr. DII absorbed the FII flow.
1-day absorption · 1537% of FII
12.67India VIX
Calm< 15 band · ▼ 3.9% d/d
India VIX at 12.67, down 3.90% d/d, deep in calm band — favours directional continuation over hedged caution.
Calm (<15)ModerateElevated (20–25)Fear (>25)
11
Decode vs Reality
graded daily
4 hit · 1 miss · 80%
30-day rolling hit rateavg 65.7%
← 30 sessions agoyesterday →
Today's calls · live
Edition 068 · 19 Jun 2026 · grading EOD
Nifty holds the 23,950–24,400 band (±~1%) into the close.
Bank Nifty closes in the 57,000–58,150 band (±~1%).
Closed 57,964, inside the 57,000–58,150 band.
✗
India Defence stays in the top half of sectors today.
India Defence closed #11 of 17, outside top_half.
✓
Auto stays in the bottom half today.
Auto closed #14 of 17 (bottom_half).
12
The bigger picture
by Tradl AI
Hormuz traffic thaws; IT bears the geopolitical tab.
The dominant force this week has been the unwinding of the West Asia risk premium. Brent is heading for a deep weekly loss as Hormuz traffic revives — but Thursday's +1.5% bounce to $79.39 tells you the market isn't done price-discovering what a durable ceasefire is actually worth. Energy and PSU names caught a bid on the tape; the relief trade remains incomplete until crude settles a new range below $80.
Domestic demand absorption is functioning. DII cash flow of 1,561 Cr on Thursday, against FII's thin 102 Cr, signals institutional depth is buffering the tape. VIX compressing to 12.67 — a drop of nearly 4% in a single session — means the options market is pricing near-term calm, which narrows the gap-down's gravitational pull unless today's RBI Minutes at 17:00 carry a hawkish surprise. Max pain at 24100 sits just below spot, a mild tailwind for bulls through expiry mechanics.
The rotation away from IT toward healthcare, financials, and real estate is the cleaner read for positioning. ASML's chip-tool concern adds a layer of export-tech headwind that earnings optimism alone cannot neutralize, making the IT-to-pharma rotation the week's most coherent internal move. Torrent Power and ICICI Lombard outperforming reinforces that utilities and financial services are absorbing the flows IT is shedding.
Every quantitative claim is cross-verified against at least two independent sources. Macro and policy claims sourced from primary regulators. AI-assisted synthesis with Tradl editorial review before publish.
★ Stay in the loop
Get the daily Decode & early access to upcoming features.
Pick what you want. Enter your details once. We'll handle the rest.